|
Sep 29, 2008
Knock, Knock: Where is the Evidence for Dangerous Human-Caused Global Warming?
By Dr. Bob Carter
Before human-caused global warming2 can become an economic problem, it first has to be identified by scientific study as a dangerous hazard for the planet, distinct from natural climate change. This notwithstanding, a number of distinguished economists have recently written compendious papers or reports on the issue, for example Nicholas Stern (2006) and William Nordhaus (2007); in Australia, Ross Garnaut3 is currently undertaking a similar analysis. These persons, and many other public commentators and politicians as well, have indicated that they accept that there is a scientific consensus that dangerous, human-caused global warming is occurring, as set by the views and advice of the Intergovernmental Panel on Climate Change (IPCC).
The IPCC is the United Nations body whose first chairman, John Houghton, wrote in 1994 that ‘unless we announce disasters, no one will listen’. From that point forward, it was obvious that IPCC pronouncements needed to be subjected to independent critical analysis; in fact, the opposite has happened, and increasingly the world’s press and politicians have come to treat IPCC utterances as if they were scribed in stone by Moses. This is a reflection, first, of superb marketing by the IPCC and its supporting cast of influential environmental and scientific organisations; second, of strong media bias towards alarmist news stories in general, and global warming political correctness in particular; and, third, of a lack of legislators and senior bureaucrats possessed of a sound knowledge of even elementary science, coupled with a similar lack of science appreciation throughout the wider electorate – our societies thereby becoming vulnerable to what can be termed ‘frisbee science’, i.e. spin.
Having decided around the turn of the 20th century that ‘the science was settled’, for the IPCC said so, politicians in industrialized societies and their economic advisors started to implement policies that they assured the public would ‘stop global warming’, notably measures to inhibit the emission of the mild greenhouse gas carbon dioxide into the atmosphere. However, the acronym GIGO (garbage in, garbage out) that has long been applied to computer modelling endeavours applies also to economic studies that purport to give policy advice against the threat of future climate change. For the reality is that no-one can predict the specific way in which climate will change in the future, beyond the general statement that multi-decadal warming and cooling trends, and abrupt climatic changes, are all certain to continue to occur. It is also the case that the science advice of the IPCC is politically cast, and thereby fundamentally flawed to a degree that makes it unsuitable for use in detailed economic forecasting and policy creation.
This is why Stern’s work, for example, has been able to be so severely criticized on both scientific and economic grounds (Carter et al. 2007; Tol 2006).
Richard Lindzen of MIT famously remarked of global warming alarmism a few years ago that ‘The consensus was reached before the research had even begun’. Another distinguished natural scientist, the late Sir Charles Fleming from New Zealand, made a similarly prescient statement when he observed in 1986 that ‘Any body of scientists that adopts pressure group tactics is endangering its status as the guardian of principles of scientific philosophy that are
worth conserving’. These quotations are apposite, because pressure-group tactics in pursuit of a falsely claimed consensus have become the characteristic modus operandi of the IPCC-led global warming alarmism that now surrounds us at every turn. The paper can be downloaded from the site of the Journal of the Economic Society of Australia (Queensland) here. Click on Bob Carter’s paper.
Sep 24, 2008
New Cycle 24 Sunspot and SSN Wavelet Analysis
By Anthony Watts, Watts Up With That
Maybe there is some hope for SC24 ramping up this year yet. This appears to be the largest SC24 spot to date. Previous SC24 spots have faded quickly, we’ll see how long this one lasts.

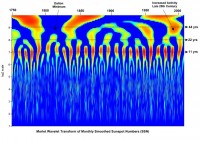
Also, courtesy Basil, a new way to look at sunspot numbers. This is a Morlet wavelet transform of smoothed sunspot numbers (SSN).

Click for the full sized image here.
Time is read along the horizontal axis, and a time scale is drawn across the top of the image. Frequency is read on the verticle axis. The scale is 2**x months, where is is 1,2,3..9. So 2**7 is 128 months. I’ve drawn lines at approximately 11 yrs, 22 yrs, and 44 yrs. Amplitude is indicated by color. The basic 11 year Schwabe cycle is clearly indicated by the red ovals bisected by the line for 11 years. I’ve noted the Dalton Minimum, which is clearly different in character than the other cycles - with weaker and longer solar cycles. It is subtle, but you can see the weaker intensity of solar cycles 10-15 compared to solar cycles 16-23 in the weaker color of the earlier cycles. There is clearly enhanced activity, and of longer duration, at the end of the 20th century.
There is also a weaker, but distinct, level of activity at 22 years, the double sunspot of Hale cycle. The last three Hale cycles have been stronger than earlier Hale cycles. There is some indication of a double Hale cycle (~44 years) and at the top of the graph, we’re in Gleissberg cycle territory.
Now, for an interesting observation and speculation, note that at present, which is at the right edge of the chart, from the 11 yr line to the top it is all blue. There is only one other place on the entire chart where we can draw a vertical line from the 11 yr line to the top without it crossing some portion of color other than blue. Can you find it? (It is right at the beginning of Solar Cycle 5, i.e. the Dalton Minimum). Are we watching the beginning of a new 200 year cycle like what began with the Dalton Minimum in the early 1800’s? Obviously, no one knows. But the current transition is certainly unusual, and invites comparison to past transitions. See more of Anthony’s post and the interesting comments here. See in this later post today that the sunspot cluster is already gone, consistent with the sunpots this minimum, small and very short-lived.
Sep 24, 2008
Colorful Study Probes Climate Change, Fall Foliage
By Lisa Rathke, Associated Press Writer
Could climate change dull the blazing palette of New England’s fall foliage? The answer could have serious implications for one of the region’s signature attractions, which draws thousands of “leaf peepers” every autumn. Biologists at the University of Vermont’s Proctor Maple Research Center will do some leaf peeping of their own to find out - studying how temperature affects the development of autumn colors and whether the warming climate could mute them, prolong the foliage viewing season or delay it.
Using a three-year, $45,000 U.S. Department of Agriculture grant, they’re planning to measure the color pigments in leaves exposed to varying temperatures in hopes of finding a pattern. The study starts next month, although some experiments are already under way. “It is getting warmer, and people want to know how that’s going to affect this big process that’s so important to us,” said research associate Abby van den Berg.
The three-week period of peak foliage color - usually from the end of September to mid-October - is among the busiest of the year for Vermont tourism, bringing in an estimated $364 million, according to state officials. It’s also an important time for tourism in the other New England states.
“It’s a critical season for us,” said Allison Truckle, owner of Tucker Hill Inn, in Waitsfield, which does about 40 percent of its business in autumn. Many variables go into triggering leaf color, but for now the research will focus on temperature. The experiment is starting with the researchers’ assumption that the brilliant colors are promoted by cold nights followed by warm, sunny days.

In previous years, the University of Vermont research center found a link between the amount of stress on sugar maples during the growing season - marked by a lower level of nitrogen in leaves - and the onset and amount of red in the leaves. “So trees that were experiencing a little more stress tended to start turning color a little earlier and making more red,” van den Berg said. Van den Berg says she’s noticed that in warmer autumns, brilliance is muted in some places. But she tries not to put too much stock in what she sees from place to place.
“It’s always great. It can be peak in different places at the same time so you just drive around and you hit all these different pockets of the landscape, so it’s always fabulous,” she said. Read more here.
Sep 23, 2008
Radical Environmentalists Part of Economic Meltdown
By Dr. Tim Ball in the Canada Free Press
Collapse of financial institutions is just part of a disturbing failure of leadership in the business segment of society. It is part of a wider crisis of leadership at all levels of society, but is the most immediate and potentially dangerous right now. The business world pushed by government has capitulated to greed and deception and has put people in financial jeopardy. The financial debacle is serious but ultimately small change compared to the cost of unnecessary programs to deal with non-existent global warming, natural climate change and many other so-called environmental problems.
As Louise Gray explained in The Daily Telegraph, 17 September 2008 about the problems facing Britain, “We are looking at something that looks like a slow motion train crash,” Fells said, accusing the government of vacillating over climate change and energy policy, starving the power industry of direction and reducing investment to a minimum.
Business with collusion from government began the capitulation when it surrendered to the bullying of environmentalists. It was exacerbated when they exploited the opportunities to make money from peoples’ fears and lack of knowledge, but none of which resolved any problems. In the long run, this will be more devastating and costly to political freedom and global economies. It is already costing the poor people of the world with higher costs or even complete unavailability of the very basics of life. It is more than mere financial greed, which people despise but expect. It includes greed but is also deliberate and cynical exploitation.
Enron has become synonymous with corporate corruption and a major part of that was with the shell game that are carbon credits. They and British Petroleum (BP) exploited the environmental issue of alternative energy and carbon credits before global warming was even a full-blown myth in the public domain. Before the company collapsed under the weight of financial scandal, Enron under CEO Ken Lay was a key proponent of the cap-and-trade idea. So was BP’s Lord John Browne, before he resigned last May under a cloud of personal scandal. In August 1997, Lay and Browne met with President Bill Clinton and Vice President Gore in the Oval Office to develop administration positions for the Kyoto negotiations that resulted in an international treaty to regulate greenhouse gas emissions. In his book, The Green Wave (Capital Research Center, 2006), author Bonner Cohen notes that the companies expected to profit handsomely from the Kyoto global warming treaty by creating the worldwide trading network in which industries would buy and sell carbon emissions credits. Source: Foundation Watch, Capital Research Center, “Crusade: The Money and Connections Behind It.” By Deborah Corey Barnes. Read more here.
Dr. Tim Ball is a renowned environmental consultant and former climatology professor at the University of Winnipeg. Dr. Ball employs his extensive background in climatology and other fields as an advisor to the International Climate Science Coalition, Friends of Science and the Frontier Centre for Public Policy.
Note along the same line see this UK Guardian story where reality is setting that environmentalist driven policy will lead to economic failure.
Sep 21, 2008
Never Ending Winter in Some Europe Ski Areas
Posted Friday 19th September 2008, by Dunx on UK Snowboard Club
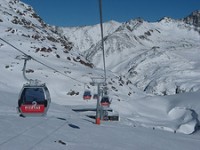
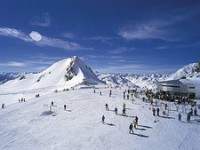
With skiing and snowboarding continuing at a few European ski areas all year round, it is difficult to know when last winter ends and this winter begins. But some glacier resorts that closed in the Spring or Summer re-open in September and stay open right through to next Spring 2009, so September seems the best candidate for the month of the year in which to declare the new ski season 2008-9 officially underway!
Fortunately, mother nature is playing ball too, with snow in the Alps last weekend. Although it is not yet open, www.Skiinfo.com reported that Val d’Isere received 9cm (just under four inches) of fresh snow at the weekend with more forecast later this week, building up their base ready for the season. It was a similar story across many other ski areas and www.Skiinfo.com works in partnership with the resorts to deliver the latest conditions several times daily.
Elsewhere in the Alps, some ski areas haven’t really closed since last winter, are still open today and will stay open through to next winter. These include the Tux and Kitzsteinhorn glaciers in Austria.
Pitztal ski area is now also open for the season.

Austria’s Stubai ski area will open for winter 2008-9 on Saturday, 27th September.

Meanwhile unseasonably cold weather in Poland this week appears to have been curtailing or hampering the Tour of Poland bicycle race.
Well to the south in the southern hemisphere, snow and record cold hit South Africa.
|
|
|
|


